Synthetic smoke tutorial#
Audience:
Users who want the smallest possible end-to-end example.
Prerequisites:
Install
scdlkit[notebook]or the fullscdlkit[tutorials]extra.
Learning goals:
Build a tiny synthetic
AnnDataobject.Run a baseline model with
TaskRunner.Save plots and a report.
Out of scope:
realistic biological interpretation
Scanpy-style downstream analysis
This notebook is a fallback and smoke path. The main researcher-facing tutorial is the Scanpy PBMC quickstart.
Links:
Repository: uddamvathanak/scDLKit
Published tutorial status
This page is a static notebook copy published for documentation review. It is meant to show the exact workflow and outputs from the last recorded run.
Last run date (UTC):
2026-03-27 09:25 UTCPublication mode:
static executed tutorialExecution profile:
publishedArtifact check in this sync:
passedSource notebook:
examples/first_run_synthetic.ipynb
Outline#
Build a synthetic dataset.
Detect the runtime device.
Train a baseline autoencoder.
Save a loss plot, latent PCA plot, and Markdown report.
from __future__ import annotations

from pathlib import Path

import numpy as np
import pandas as pd
import torch
from anndata import AnnData
from IPython.display import display

from scdlkit import TaskRunner

OUTPUT_DIR = Path("artifacts/first_run_notebook")
OUTPUT_DIR.mkdir(parents=True, exist_ok=True)

device_name = "cuda" if torch.cuda.is_available() else "cpu"
print(f"Using device: {device_name}")
Using device: cpu
def make_synthetic_adata(n_cells: int = 120, n_genes: int = 32, seed: int = 42) -> AnnData:
    rng = np.random.default_rng(seed)
    base = rng.normal(size=(n_cells, n_genes)).astype("float32")
    labels = np.array(["T-cell"] * (n_cells // 2) + ["B-cell"] * (n_cells // 2))
    batches = np.array(["batch_a"] * (n_cells // 4) + ["batch_b"] * (n_cells // 4))[: n_cells // 2]
    batches = np.concatenate([batches, batches])
    signal = np.where(labels[:, None] == "T-cell", 1.0, -1.0).astype("float32")
    x_matrix = base + 0.6 * signal
    obs = pd.DataFrame(
        {"cell_type": labels, "batch": batches},
        index=[f"cell_{idx}" for idx in range(n_cells)],
    )
    var = pd.DataFrame(index=[f"gene_{idx}" for idx in range(n_genes)])
    return AnnData(X=x_matrix, obs=obs, var=var)

adata = make_synthetic_adata()
adata
AnnData object with n_obs × n_vars = 120 × 32
    obs: 'cell_type', 'batch'
Train the smoke-test model#
This uses the same device="auto" behavior as the main tutorials.
runner = TaskRunner(
    model="autoencoder",
    task="representation",
    latent_dim=8,
    hidden_dims=(64, 32),
    epochs=5,
    batch_size=16,
    lr=1e-3,
    label_key="cell_type",
    batch_key="batch",
    device="auto",
    output_dir=str(OUTPUT_DIR),
)
runner.fit(adata)
metrics = runner.evaluate()
metrics
{'mse': 1.1759850978851318,
 'mae': 0.8703315258026123,
 'pearson': 0.2806214690208435,
 'spearman': 0.2864191344535705,
 'silhouette': 0.6296346187591553,
 'knn_label_consistency': 1.0,
 'ari': 1.0,
 'nmi': 1.0,
 'batch_silhouette': -0.07306970655918121}
Save plots and report#
The smoke notebook writes all artifacts to artifacts/first_run_notebook/.
runner.save_report(OUTPUT_DIR / "report.md")
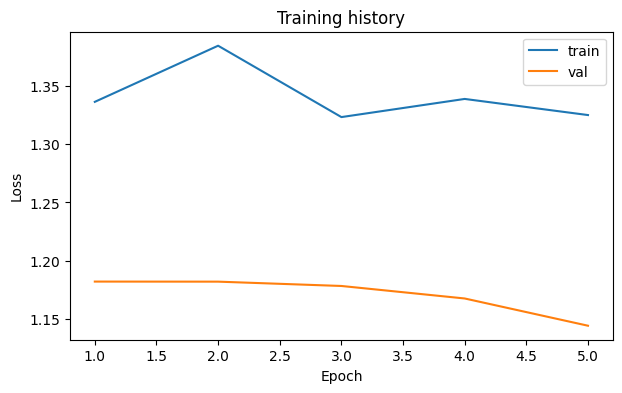
loss_fig, _ = runner.plot_losses()
loss_fig.savefig(OUTPUT_DIR / "loss_curve.png", dpi=150, bbox_inches="tight")
display(loss_fig)
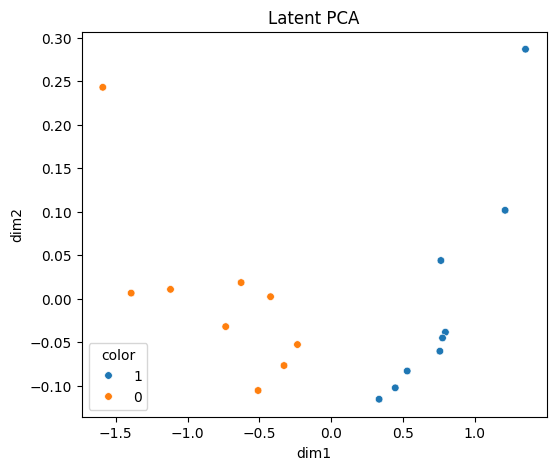
latent_fig, _ = runner.plot_latent(method="pca", color="cell_type")
latent_fig.savefig(OUTPUT_DIR / "latent_pca.png", dpi=150, bbox_inches="tight")
display(latent_fig)
Expected outputs#
You should see:
a scalar metrics dictionary
artifacts/first_run_notebook/report.mdartifacts/first_run_notebook/report.csvartifacts/first_run_notebook/loss_curve.pngartifacts/first_run_notebook/latent_pca.png
After this smoke path, move to the Scanpy PBMC quickstart for the main researcher workflow.
output_paths = {
    "report_md": str(OUTPUT_DIR / "report.md"),
    "report_csv": str(OUTPUT_DIR / "report.csv"),
    "loss_curve_png": str(OUTPUT_DIR / "loss_curve.png"),
    "latent_pca_png": str(OUTPUT_DIR / "latent_pca.png"),
}
output_paths
{'report_md': 'artifacts/first_run_notebook/report.md',
 'report_csv': 'artifacts/first_run_notebook/report.csv',
 'loss_curve_png': 'artifacts/first_run_notebook/loss_curve.png',
 'latent_pca_png': 'artifacts/first_run_notebook/latent_pca.png'}