Reconstruction sanity check on PBMC#
Audience:
Researchers who want to inspect predicted or reconstructed gene-expression outputs from a reconstruction-capable baseline.
Prerequisites:
Install
scdlkit[tutorials].Know the Scanpy PBMC quickstart notebook first.
Learning goals:
train a simple reconstruction baseline on processed PBMC
retrieve reconstructed expression with
runner.reconstruct(...)inspect one-gene reconstruction scatter and a small marker panel summary
understand what reconstructed expression is useful for and what it is not
Out of scope:
claiming biological truth from reconstructed expression
full denoising benchmarks
heavy gene-level exploratory analysis
This notebook uses a plain autoencoder so the reconstruction story stays easy to inspect.
Published tutorial status
This page is a static notebook copy published for documentation review. It is meant to show the exact workflow and outputs from the last recorded run.
Last run date (UTC):
2026-03-27 09:24 UTCPublication mode:
static executed tutorialExecution profile:
publishedArtifact check in this sync:
passedSource notebook:
examples/reconstruction_sanity_pbmc.ipynb
Outline#
Load processed PBMC data.
Train an autoencoder reconstruction baseline.
Save a short report and loss curve.
Retrieve reconstructed expression with
runner.reconstruct(...).Inspect one-gene scatter and a small marker panel summary.
Save output artifact paths.
from __future__ import annotations

from pathlib import Path

import numpy as np
import pandas as pd
import scanpy as sc
import torch
from IPython.display import display
from matplotlib import pyplot as plt
from sklearn.model_selection import train_test_split

from scdlkit import TaskRunner

OUTPUT_DIR = Path("artifacts/reconstruction_sanity_pbmc")
OUTPUT_DIR.mkdir(parents=True, exist_ok=True)

TUTORIAL_PROFILE = "quickstart"  # change to "full" for a longer run
PROFILE = {
    "quickstart": {"max_cells": 1500, "epochs": 15, "batch_size": 128},
    "full": {"max_cells": None, "epochs": 35, "batch_size": 128},
}[TUTORIAL_PROFILE]

print(f"Using device: {'cuda' if torch.cuda.is_available() else 'cpu'}")
print(f"Tutorial profile: {TUTORIAL_PROFILE}")
print(PROFILE)
Using device: cpu
Tutorial profile: quickstart
{'max_cells': 1500, 'epochs': 15, 'batch_size': 128}
Load PBMC data#
The same processed PBMC dataset keeps this tutorial aligned with the main quickstart while staying focused on reconstruction behavior.
def stratified_subset(adata, label_key: str, max_cells: int | None, seed: int = 42):
    if max_cells is None or adata.n_obs <= max_cells:
        return adata.copy()
    indices = np.arange(adata.n_obs)
    labels = adata.obs[label_key].astype(str).to_numpy()
    keep_indices, _ = train_test_split(
        indices,
        train_size=max_cells,
        random_state=seed,
        stratify=labels,
    )
    return adata[np.sort(keep_indices)].copy()

adata = sc.datasets.pbmc3k_processed()
adata = stratified_subset(adata, "louvain", PROFILE["max_cells"])
print(adata)
AnnData object with n_obs × n_vars = 1500 × 1838
    obs: 'n_genes', 'percent_mito', 'n_counts', 'louvain'
    var: 'n_cells'
    uns: 'draw_graph', 'louvain', 'louvain_colors', 'neighbors', 'pca', 'rank_genes_groups'
    obsm: 'X_pca', 'X_tsne', 'X_umap', 'X_draw_graph_fr'
    varm: 'PCs'
    obsp: 'distances', 'connectivities'
Train the reconstruction baseline#
Use the reconstruction task explicitly here. The point is to inspect the predicted expression output, not to optimize for latent separation.
runner = TaskRunner(
    model="autoencoder",
    task="reconstruction",
    epochs=PROFILE["epochs"],
    batch_size=PROFILE["batch_size"],
    device="auto",
    output_dir=str(OUTPUT_DIR),
)
runner.fit(adata)
metrics = runner.evaluate()
metrics
{'mse': 0.8139280080795288,
 'mae': 0.3975978493690491,
 'pearson': 0.20109763741493225,
 'spearman': 0.11078534881440727}
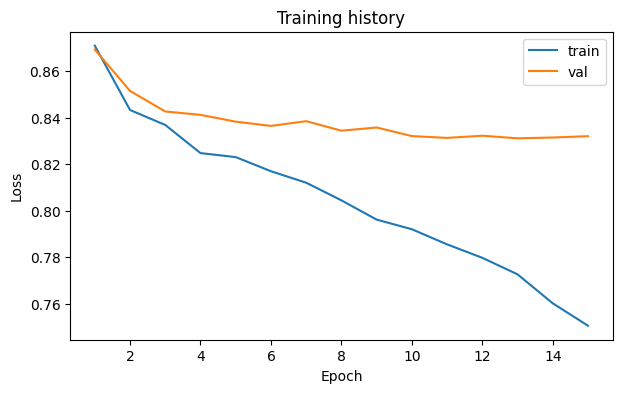
Save the report and inspect the loss curve#
This notebook should leave behind a compact report and a loss curve before any gene-level inspection starts.
runner.save_report(OUTPUT_DIR / "report.md")
loss_fig, _ = runner.plot_losses()
loss_fig.savefig(OUTPUT_DIR / "loss_curve.png", dpi=150, bbox_inches="tight")
display(loss_fig)
plt.close(loss_fig)
Retrieve reconstructed expression#
runner.reconstruct(...) is the clear public path for reconstruction-capable models. This is the output you should inspect when checking whether a feature is wired correctly.
reconstructed = runner.reconstruct(adata)
reconstructed.shape
(1500, 1838)
One-gene reconstruction scatter#
Start with one interpretable marker so the relationship between observed and reconstructed values is easy to see.
candidate_genes = [gene for gene in ["MS4A1", "LYZ", "NKG7", "IL7R"] if gene in adata.var_names]
feature_gene = candidate_genes[0] if candidate_genes else adata.var_names[0]

scatter_fig, _ = runner.plot_reconstruction(feature=feature_gene)
scatter_fig.savefig(OUTPUT_DIR / "reconstruction_scatter.png", dpi=150, bbox_inches="tight")
display(scatter_fig)
plt.close(scatter_fig)
print(f"Using feature gene: {feature_gene}")
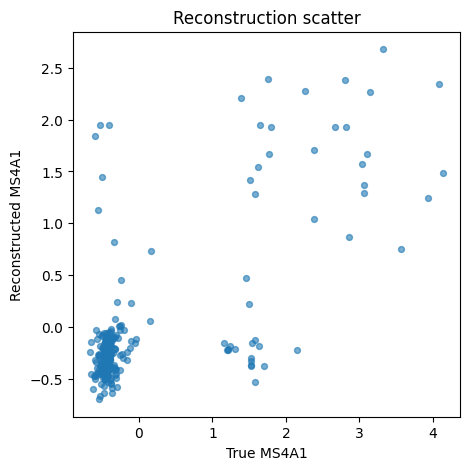
Using feature gene: MS4A1
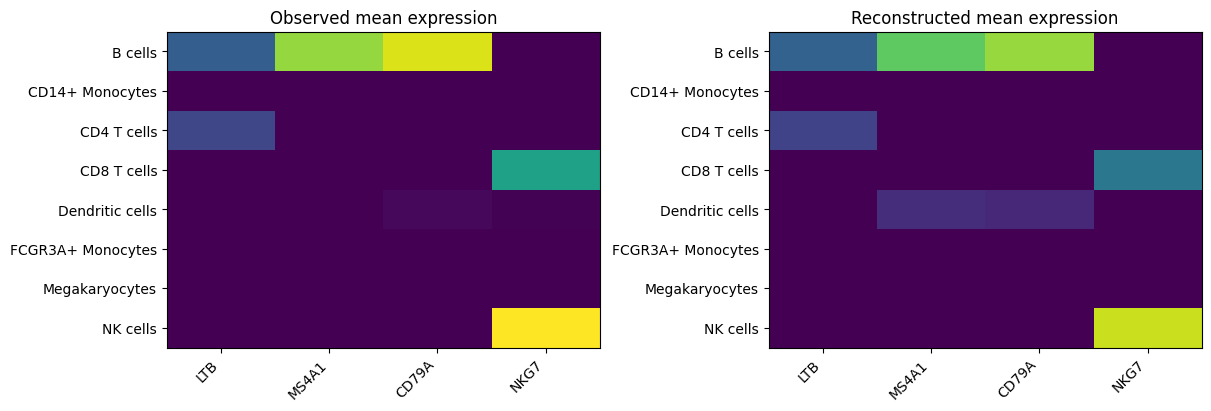
Marker-panel reconstruction summary#
This is a coarse sanity check only. We compare mean observed vs reconstructed expression across PBMC groups for a small marker panel.
marker_candidates = ["IL7R", "LTB", "MS4A1", "CD79A", "LYZ", "NKG7"]
marker_panel = [gene for gene in marker_candidates if gene in adata.var_names]
observed_matrix = adata[:, marker_panel].X
if hasattr(observed_matrix, "toarray"):
    observed_matrix = observed_matrix.toarray()
observed = pd.DataFrame(observed_matrix, columns=marker_panel, index=adata.obs_names).astype(float)
reconstructed_df = pd.DataFrame(
    reconstructed[:, [adata.var_names.get_loc(gene) for gene in marker_panel]],
    columns=marker_panel,
    index=adata.obs_names,
).astype(float)

observed["louvain"] = adata.obs["louvain"].astype(str).to_numpy()
reconstructed_df["louvain"] = adata.obs["louvain"].astype(str).to_numpy()

observed_means = observed.groupby("louvain").mean(numeric_only=True)
reconstructed_means = reconstructed_df.groupby("louvain").mean(numeric_only=True)

fig, axes = plt.subplots(1, 2, figsize=(12, 4), constrained_layout=True)
vmax = max(float(observed_means.to_numpy().max()), float(reconstructed_means.to_numpy().max()))
axes[0].imshow(observed_means.to_numpy(), aspect="auto", cmap="viridis", vmin=0, vmax=vmax)
axes[0].set_title("Observed mean expression")
axes[1].imshow(reconstructed_means.to_numpy(), aspect="auto", cmap="viridis", vmin=0, vmax=vmax)
axes[1].set_title("Reconstructed mean expression")
for axis in axes:
    axis.set_xticks(range(len(marker_panel)))
    axis.set_xticklabels(marker_panel, rotation=45, ha="right")
    axis.set_yticks(range(len(observed_means.index)))
    axis.set_yticklabels(list(observed_means.index))
fig.savefig(OUTPUT_DIR / "gene_panel_reconstruction.png", dpi=150, bbox_inches="tight")
display(fig)
plt.close(fig)
observed_means.head()
| LTB | MS4A1 | CD79A | NKG7 | |
|---|---|---|---|---|
| louvain | ||||
| B cells | 0.737258 | 2.069788 | 2.330160 | -0.526241 |
| CD14+ Monocytes | -0.972925 | -0.336502 | -0.391754 | -0.415092 |
| CD4 T cells | 0.518906 | -0.310609 | -0.334568 | -0.387462 |
| CD8 T cells | -0.119601 | -0.344340 | -0.421676 | 1.409332 |
| Dendritic cells | -0.946825 | -0.056058 | 0.054287 | 0.019020 |
Expected outputs and interpretation#
After running this notebook, check:
artifacts/reconstruction_sanity_pbmc/report.mdartifacts/reconstruction_sanity_pbmc/report.csvartifacts/reconstruction_sanity_pbmc/loss_curve.pngartifacts/reconstruction_sanity_pbmc/reconstruction_scatter.pngartifacts/reconstruction_sanity_pbmc/gene_panel_reconstruction.png
Interpretation checklist:
The loss curve should decrease without looking obviously unstable.
The reconstruction scatter should show broad correlation, not a random cloud.
The marker-panel summary should preserve broad PBMC trends, not exact cell-by-cell truth.
Treat reconstructed expression as model output, not corrected biological ground truth.
Recommended next tutorials:
the downstream Scanpy notebook for cluster interpretation after embedding learning
the custom-model tutorial if you want to build your own reconstruction baseline
output_paths = {
    "report_md": str(OUTPUT_DIR / "report.md"),
    "report_csv": str(OUTPUT_DIR / "report.csv"),
    "loss_curve_png": str(OUTPUT_DIR / "loss_curve.png"),
    "reconstruction_scatter_png": str(OUTPUT_DIR / "reconstruction_scatter.png"),
    "gene_panel_reconstruction_png": str(OUTPUT_DIR / "gene_panel_reconstruction.png"),
}
output_paths
{'report_md': 'artifacts/reconstruction_sanity_pbmc/report.md',
 'report_csv': 'artifacts/reconstruction_sanity_pbmc/report.csv',
 'loss_curve_png': 'artifacts/reconstruction_sanity_pbmc/loss_curve.png',
 'reconstruction_scatter_png': 'artifacts/reconstruction_sanity_pbmc/reconstruction_scatter.png',
 'gene_panel_reconstruction_png': 'artifacts/reconstruction_sanity_pbmc/gene_panel_reconstruction.png'}